Retail has always been and will always be about choices. Brands and retailers strive to offer the widest and deepest assortment possible to attract substantial consumer traffic. Among other things, success in mass retailing heavily depends on pricing and promotions. The present day challenge for brands and retailers is to sift through the increasingly competitive, complex and ever-growing retail universe. The proliferation of open source platforms like Magento and mobile commerce solutions has led to a huge spurt in online retailers.
Brands and retailers can no longer effectively monitor their competitors through sampling methodologies. Apart from being archaic and time-consuming, they are an obsolete way of tracking fluctuations in today’s highly volatile retail environment. It’s neither the easiest nor the most accurate way of sifting through thousands of products across multiple retailers. Consider the kind of observations that would’ve to be made for every unique product to extract any valuable information – price, discount (if any), available sizes, brand, colour, gender, fabric, material, in-stock, out-of-stock, analog, digital etc. Attempting to monitor the competition with anything other than a retail analytics suite would be rudimentary.
A top of the line retail analytics suite like ours captures billions of data points from marketplaces across the globe to churn insights out of them. These insights are visualized on various dashboards throughout the platform to make for easy assimilation and quick action. Having access to retail dashboards is like subscribing to an exhaustive market report, the only difference being that it’s all in real-time. Let us show you how that looks like –
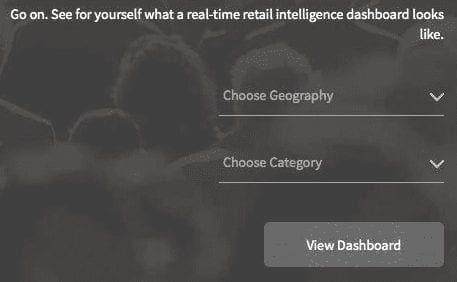
Take a quick look at the competition
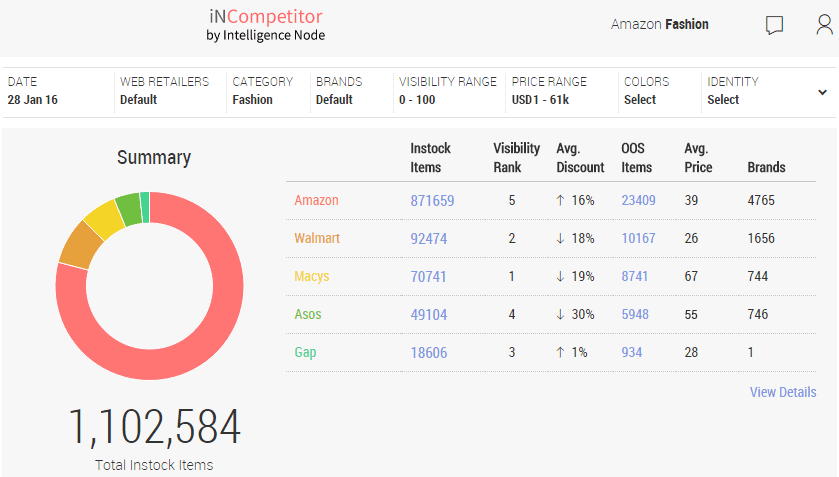
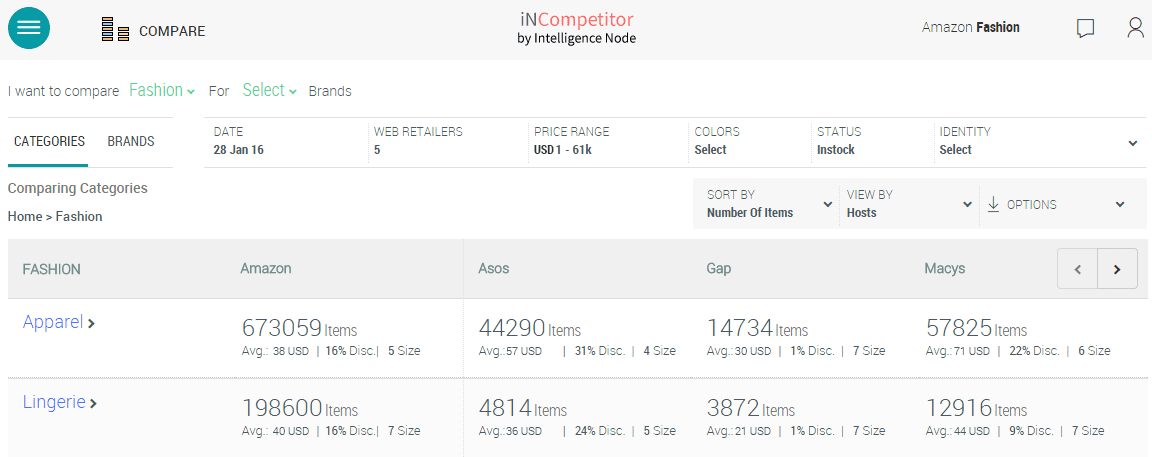
The summary retail analytics dashboard gives a quick overview of what your closest competitors are up to. The above screenshot shows a dashboard for the fashion category across 5 retailers in the US. According to the dashboard, Amazon has the widest fashion range with 871,659 SKUs as of 28-Jan-16. Asos offered the largest discount (30%) that day, while Wal-Mart had the lowest average price of 26 USD. Of the 5 US retailers being compared Wal-Mart is Amazon’s closest competitor in terms of catalogue size with 92,474 SKUs. Macy’s has been found to have the highest average price (67 USD) among the 5 retailers. Pricing intelligence of this sort can be used by retailers to tweak their ticket prices to be on par with the competition within categories that matter to them.
Track events
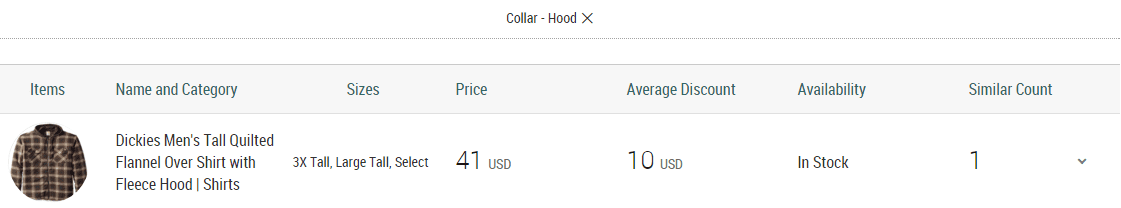
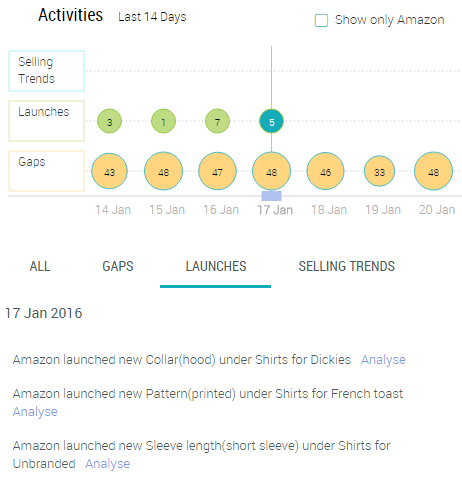
Events like gaps and new launches are something that no retailer would want to miss out on. For instance, gaps are an opportunity for retailers to optimize visibility and prices on their marketplaces. In the above screenshot you can see that on the 17th of Jan’16, Amazon launched several new variants of shirts. Here are some snapshots of those new launches –
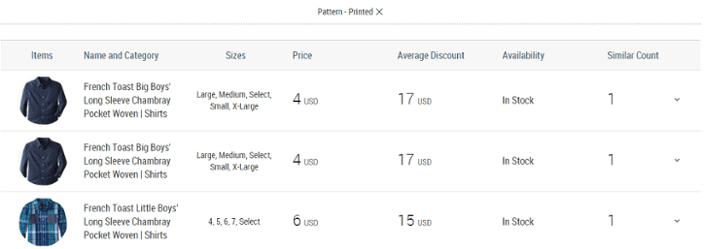
Retailers can check these new items on the fly and assess whether they should stock them too.
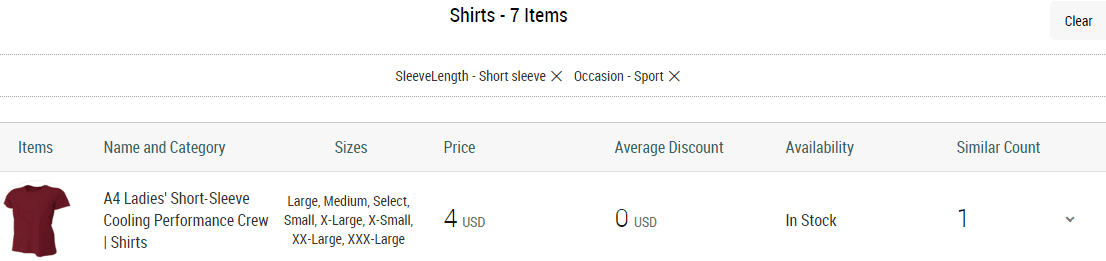
Likewise, retailers can identify gaps in their competitors’ catalogues and increase visibility of those variants if they have them in stock.
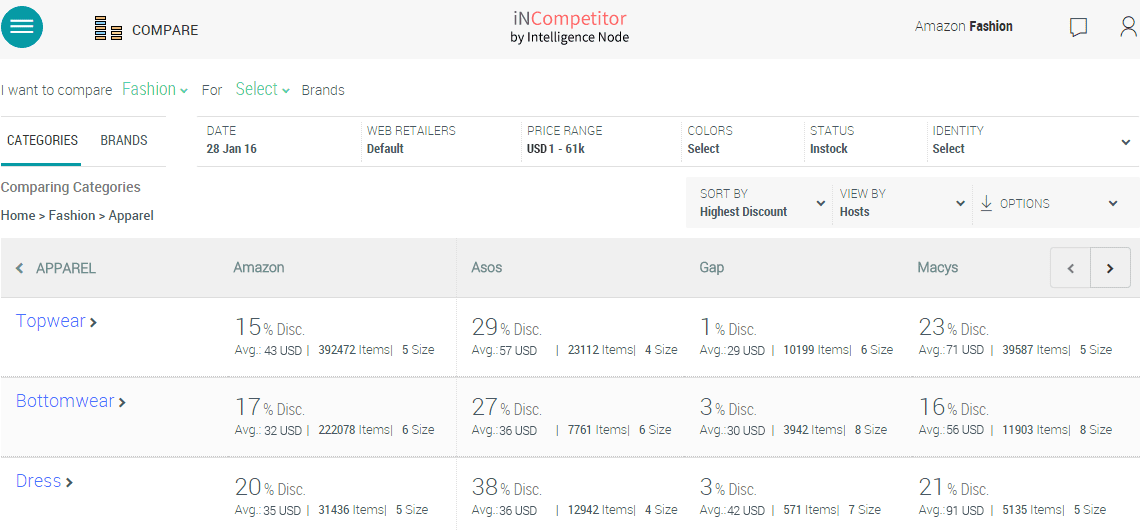
Compare Categories
Retail analytics makes it possible for brands and retailers to compare categories across multiple marketplaces. Comparison can be done on the basis of price difference, number of items and highest discount.
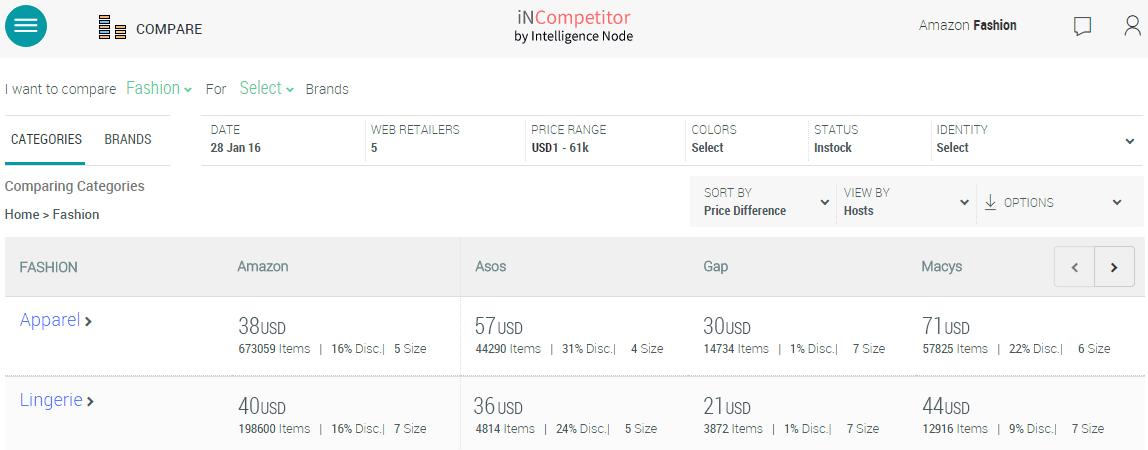
While retailers can easily peek into their competitors’ marketplaces, brands too can keep tabs on other brands which deal in the same categories.
Analyze Categories
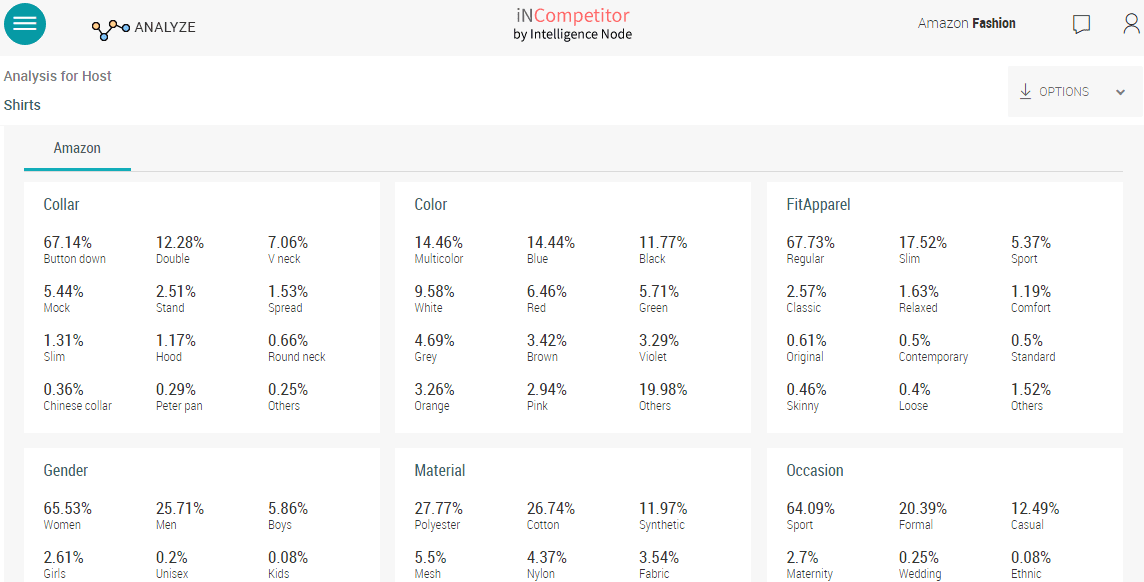
Retail analytics breaks down categories into their various attributes and analyzes them to aid decision making. Consider the above real-time dashboard which examines Amazon’s Shirts category. Cotton & Polyester seem to be the top materials of choice and majority of them are of them are of the button-down collar variety. Also, after multicolour, blue and black are the colours most favoured by Amazon. This is just the kind of intelligence retailers need to plan their merchandise assortment and ensure that they are on the right path.
Discount & Price Analysis
Discounts are a staple of the e-commerce industry. With retail analytics it is easy to see what discounts different retailers are applying on different categories. Brands too can check what kind of discounts their competitors are indulging in. Also, average prices across retailers and brands can be compared for competitiveness.
Visibility Analysis
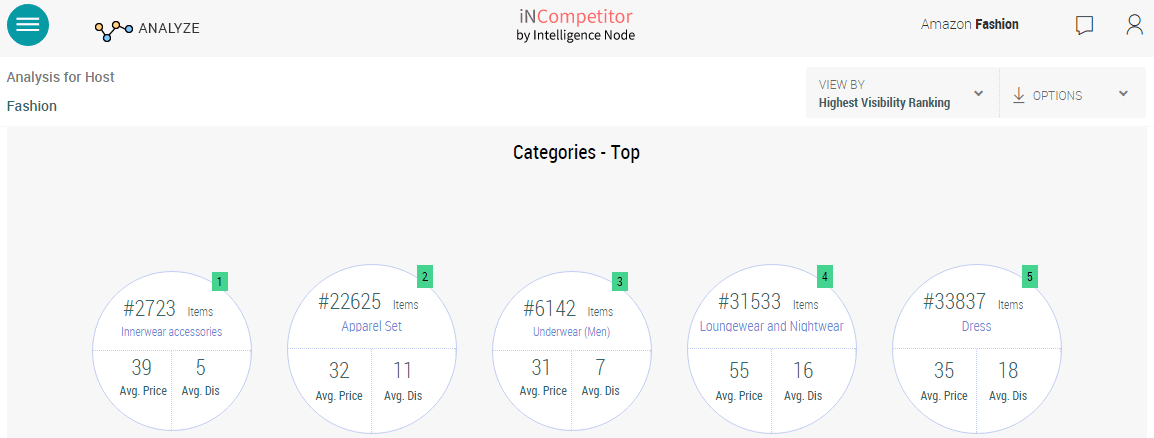
The more a visible a product is, the more its chances of being added to the shopping cart. IntelligenceNode ranks products and categories according to the frequency and position at which they are featured throughout the website. High visibility rank indicates that the product or category is either in great demand or being promoted heavily by the retailer.
Retail analytics dashboards help market leaders maintain pole position and empower those who wish to thrive. With retail analytics, retailers can push the right product, at the right price, in real-time. We are eager to demonstrate the various challenges retail analytics can overcome for retailers.
Sign up for our demo and we’ll show you how insights can be automated into real-time actions. Click here.