What is our Spikes & Dips Series?
Intelligence Node’s Spikes & Dips series tracks the retail price change of a basket of products spread across online retailers using our real-time retail analytics software. ‘Spikes & Dips’ covers the top 1000+ leading North American e-commerce retailers and is continuously monitored by proprietary market-monitoring algorithms. Intelligence Node’s algorithm processes approximately 750mn products daily and are taken from real-time, live data. All benchmark indexes are tracked in real-time, however, updates will be published in our monthly State of E-commerce newsletter.
The goal of our Spikes and Dips series is to put online retail price movements in the context of macroeconomic factors thus enabling retailers to understand how these macroeconomic factors influence their day-to-day retail pricing strategies.
Number of Products

March 2016 saw an increase in SKUs across categories, a complete opposite of February 2016. This is a clear indication that retailers have finally refreshed their stock offerings for the new season. In March, the number of products listed online went up by 25% across the main categories MoM. Product listing in the Home & Décor category nearly doubled in March.
The average growth across the categories Fashion, Electronics and Beauty & Care stood at ~30% MoM. Food & Grocery was the only category which declined by 10% MoM.
We observed that the share of Amazon’s product listing in the total US catalog doubled in March as compared to the 19% in February. Rakuten (19%) and Sears (15%) too saw an upward trend in product listings- constituting a large share of the overall catalog, compared to Walmart (14%), which stayed stable.

We noted categories where most SKUs were added.

We observed that ~90% of the total US catalog was listed under the categories Fashion, Home & Décor and Electronics. While the share of Fashion and Electronics remained almost the same in March compared to February, the same was increased by 4% in Home & Décor.
Average Price & Discount
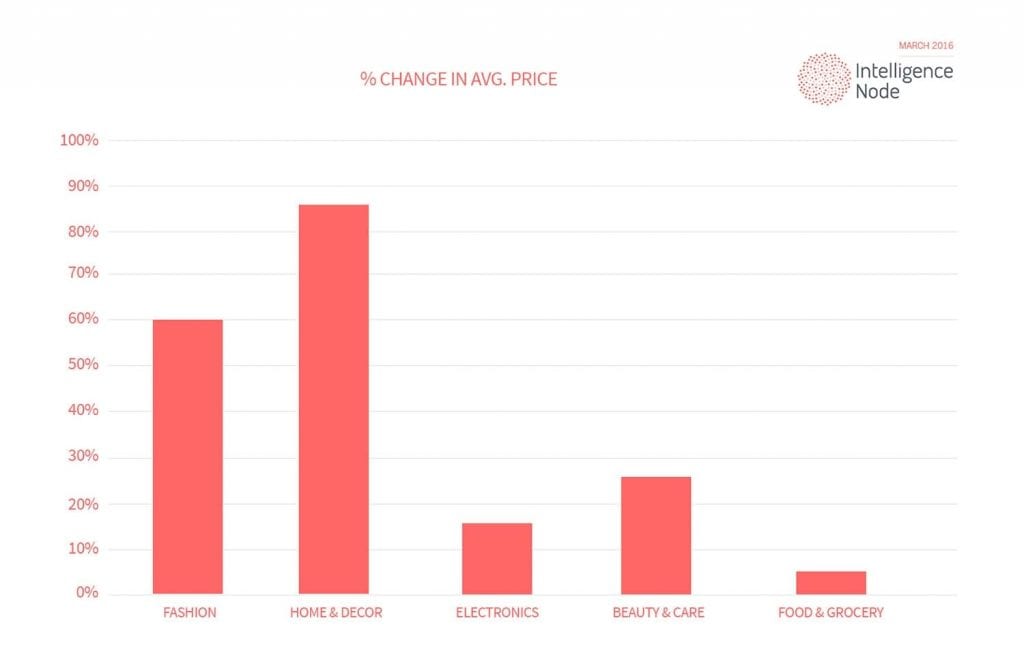
We studied the price movements in March 2016 vis a vis February 2015 to understand the pricing changes in various verticals. This chart reflects the average price changes in the month of March 2016.

The price jump has continued into March across all categories.
The most notable category- with the highest level of increase in the average price was Home & décor.

We studied the retailers who witnessed a rise in average prices. The table shows the % change in the prices by various retailers across categories.
What is Trending?
We looked at various price, discount and catalogue movements to discover trends for various categories.
The trend decline in February was reversed in March, with new stocks being added to catalogs across all major categories. At 73% MoM, Home & décor witnessed the highest jump in rankings. Fashion and Food & Grocery categories rose at 30% MoM.

Insights by Player: Amazon vs. Walmart

This chart compares the change in average price between February and March for Amazon and Walmart. We observed that Walmart’s pricing was clearly more aggressive than Amazon.
Electronics and Beauty & care categories saw the highest decrease in pricing on Amazon. Walmart however, increased the average price across these categories to the most among the main categories. Average prices dropped across all the categories on Amazon.

The net average price on Amazon declined in March by as high as 14% MoM. On the other hand, the average price remained constant on Walmart. At 28%, the electronics category saw the highest traction in terms of price and assortment on Walmart. Similarly on Amazon, Pets Shop, at 35%, saw the highest traction. Except for Pets Shop, all the categories on Amazon witnessed a decline MoM.
Both Amazon and Walmart failed to cash in on the month’s hottest category- Home & décor.
Conclusion
The activity graph made an about turn in March. This was expected, as retailer focus was on replenishing stocks as well as strategizing for and adapting to the new trends after the holiday season. The March Spikes & Dips Series built upon the movements we saw in February, as retailers actively started replenishing catalogs for the new season.
Intelligence Node can provide highly targeted insights – including SKU based analytics – to help you monitor your competition in real time. Request a free demo and learn how to harness the true power of retail analytics to drive business success.
To request a demo, click here.